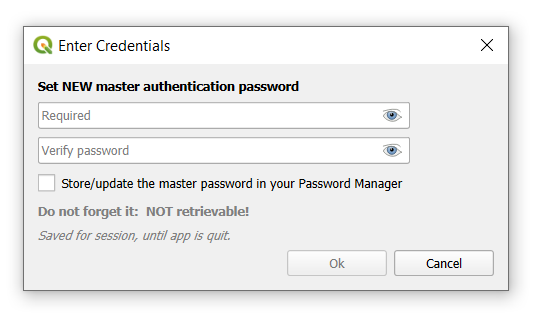
Вам будет предложено установить новый аутентификационный мастер-пароль - функция qgis, которая обеспечивает безопасность хранения конфиденциальной информации.
3. НажмитеВойти
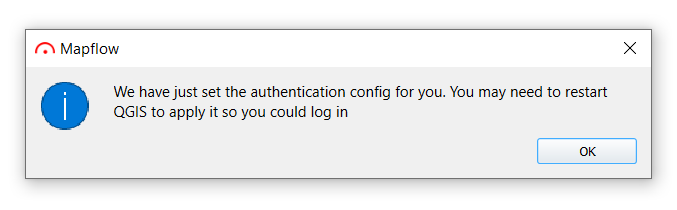
Вы получите следующее сообщение, перезапустите QGIS перед выполнением следующих шагов.
4. После перезапуска QGIS, нажмитеВойти
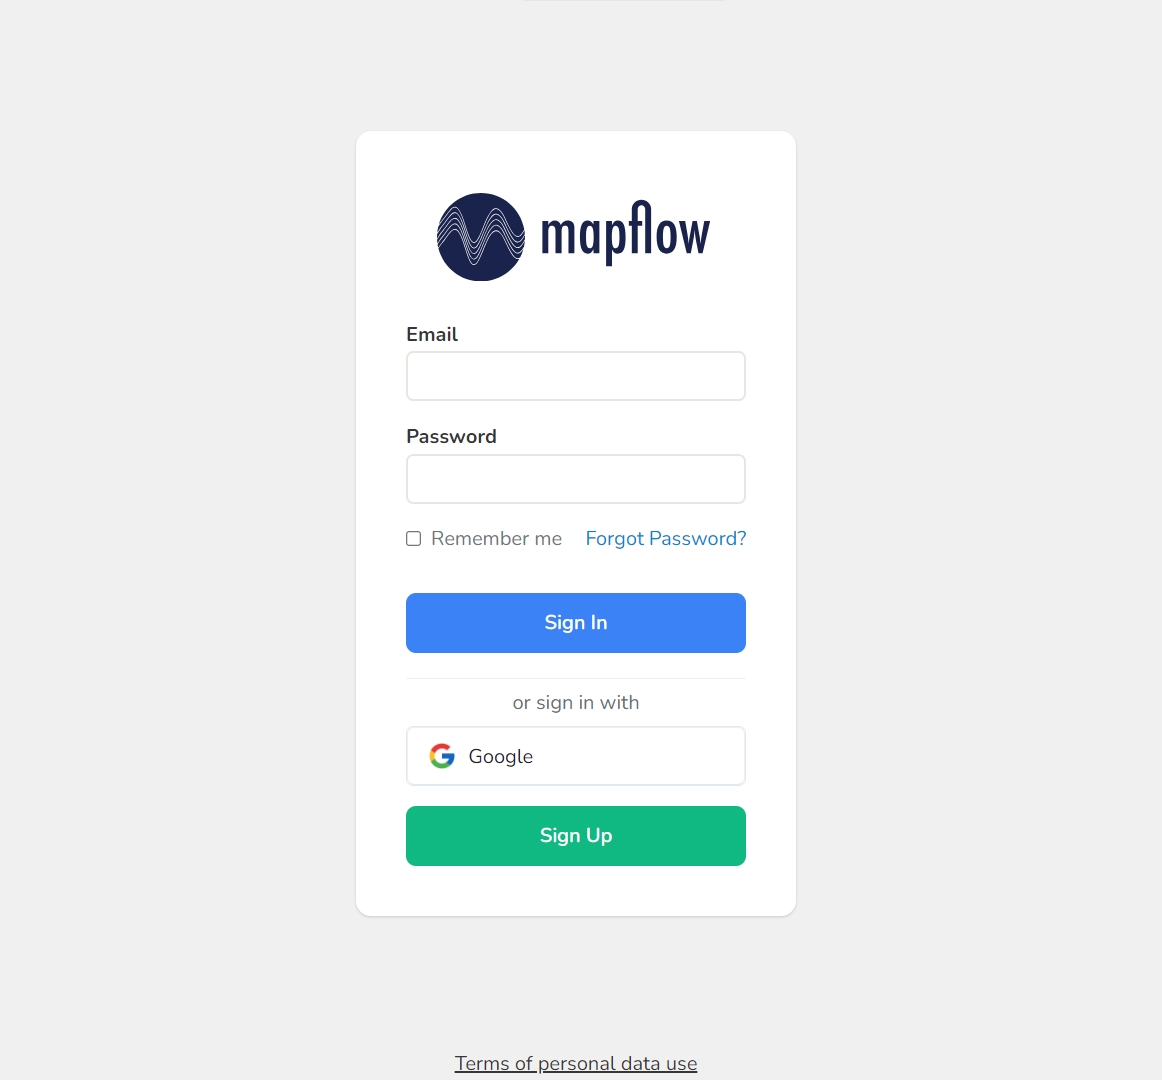
Вы будете перенаправлены в браузер для входа в систему/регистрации в системе mapflow:
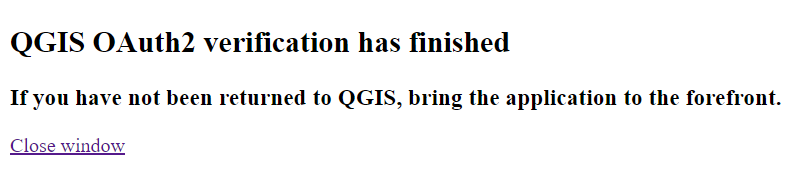
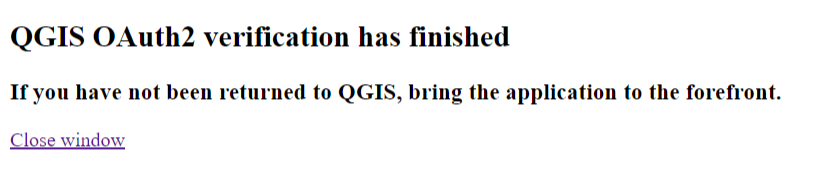
После успешного входа в систему вы получите сообщение об успешной проверке QGIS OAuth2:
Примечание
Можете закрыть эту страницу
5. Вернитесь в QGIS
Входе через OAuth завершен!
Важно
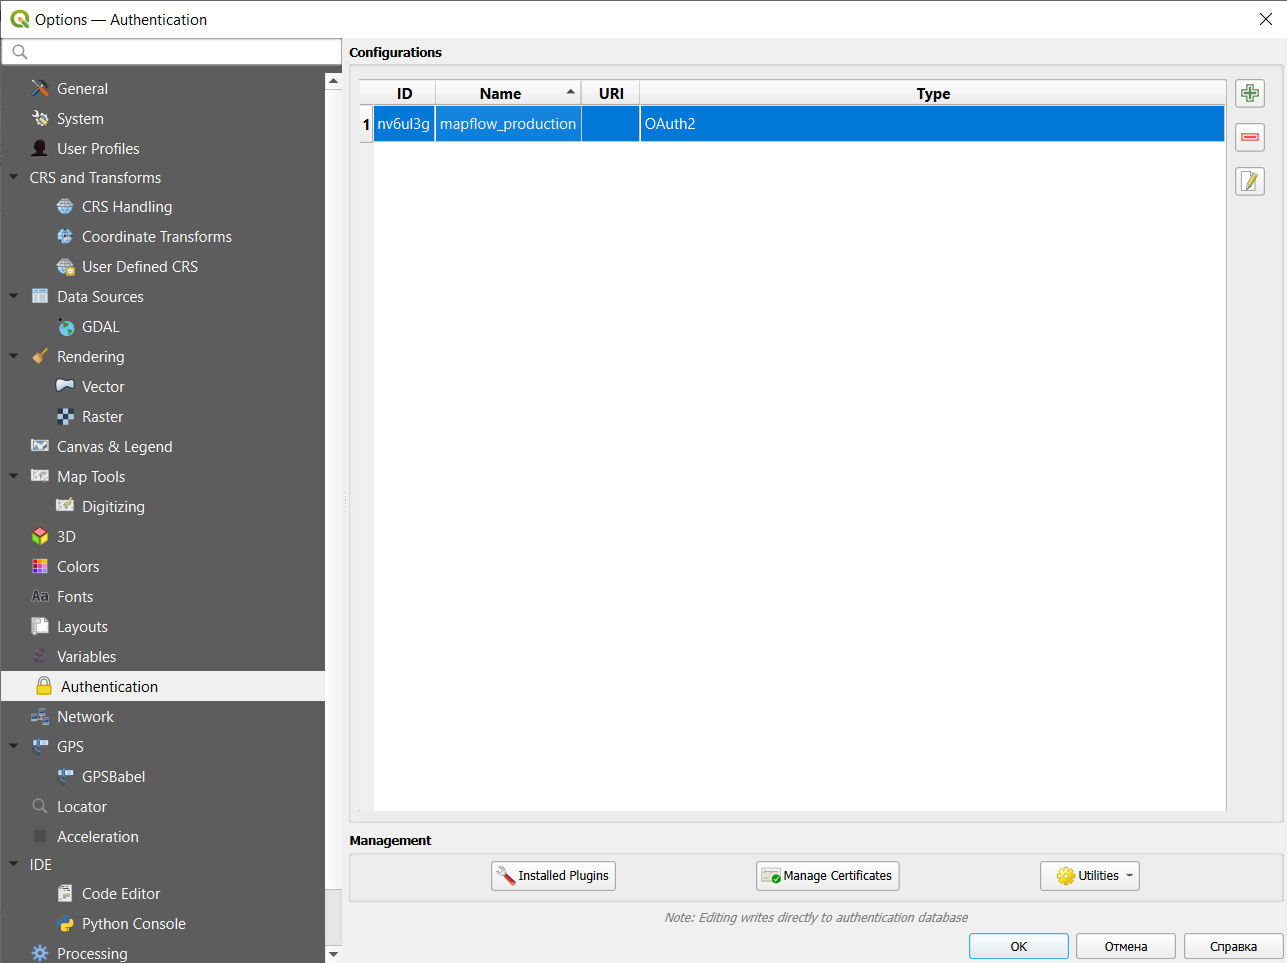
Если у вас возникли серьезные проблемы с авторизацией, вы можете удалить конфигурацию аутентификации, перейдя в Настройки->Параметры->Аутентификация, выберите конфигурацию и удалите ее:
Картографирование объектов на снимках ДЗЗ с помощью плагина Mapflow для QGIS
Дешифрирование и последующая оцифровка растровых изображений – довольно трудоемкий процесс. Использование технологий распознавания образов с помощью искусственного интеллекта ведет к снижению трудозатрат и повышению скорости обработки данных.
В геоинформационной системе QGIS процесс оцифровки объектов различного вида может быть автоматизирован с помощью плагина Mapflow. Для этого необходимо осуществить нижеописанные шаги.
1. Установка плагина Mapflow для QGIS и авторизация
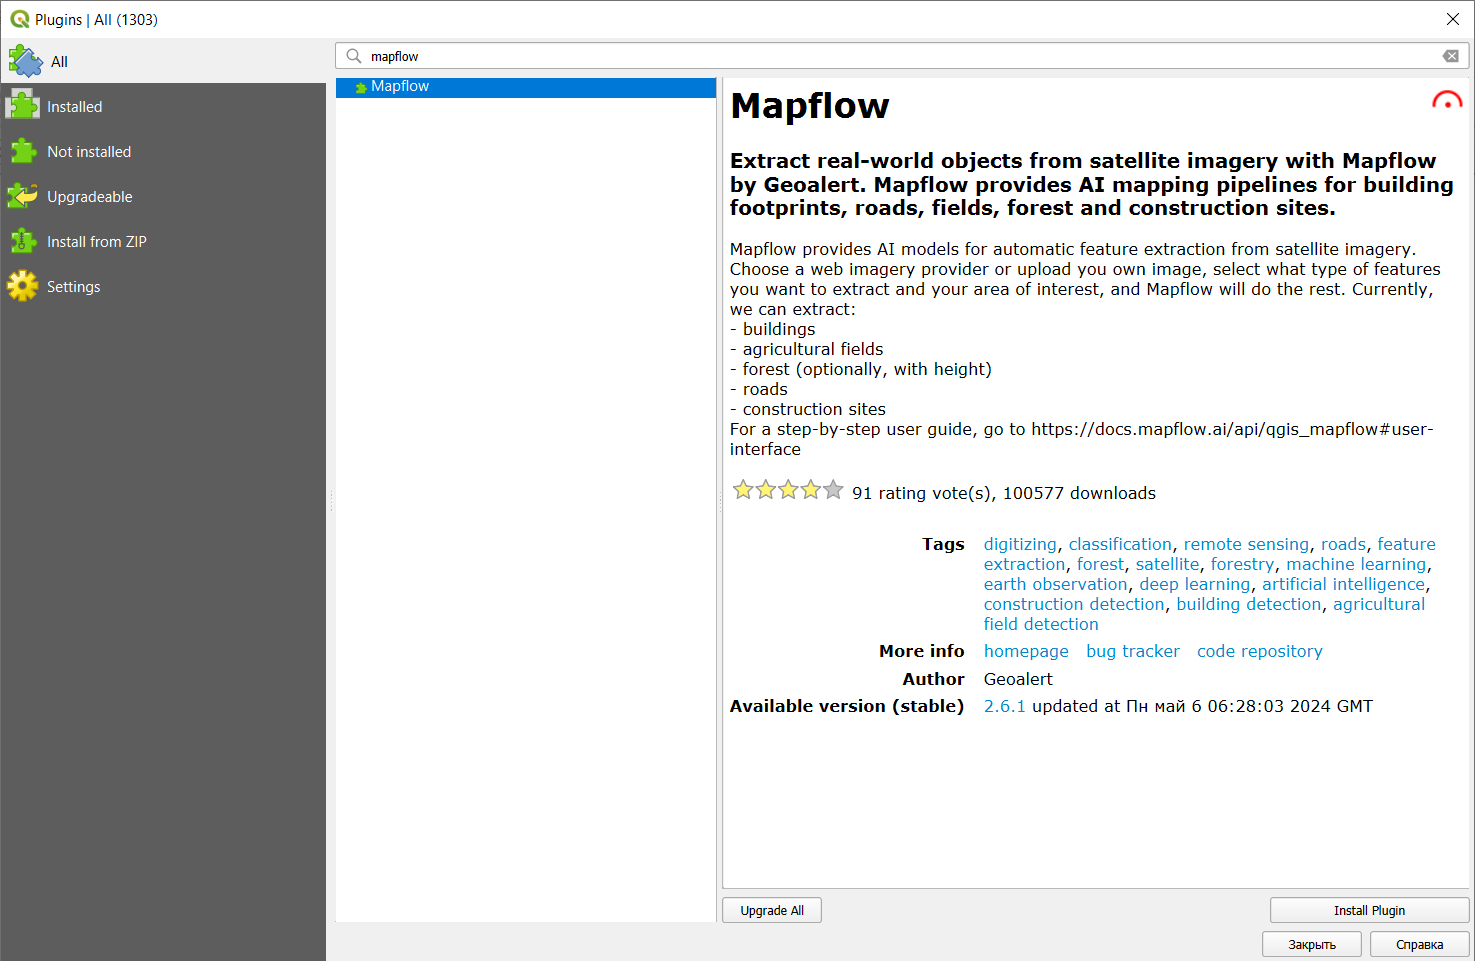
Прежде всего необходимо установить плагин в QGIS. Для этого в главном окне программы следует перейти на вкладку Plugins -> Manage and Install Plugins, найти Mapflow с помощью поисковой строки и нажать Install Plugin.
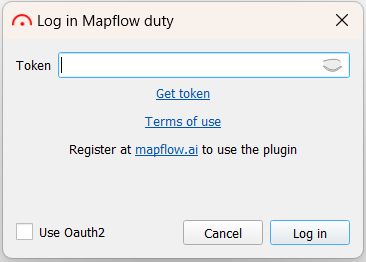
После установки иконка плагина появится в панели инструментов: . Нажав на неё, откроем окно авторизации, в котором необходимо кликнуть на «Get token».
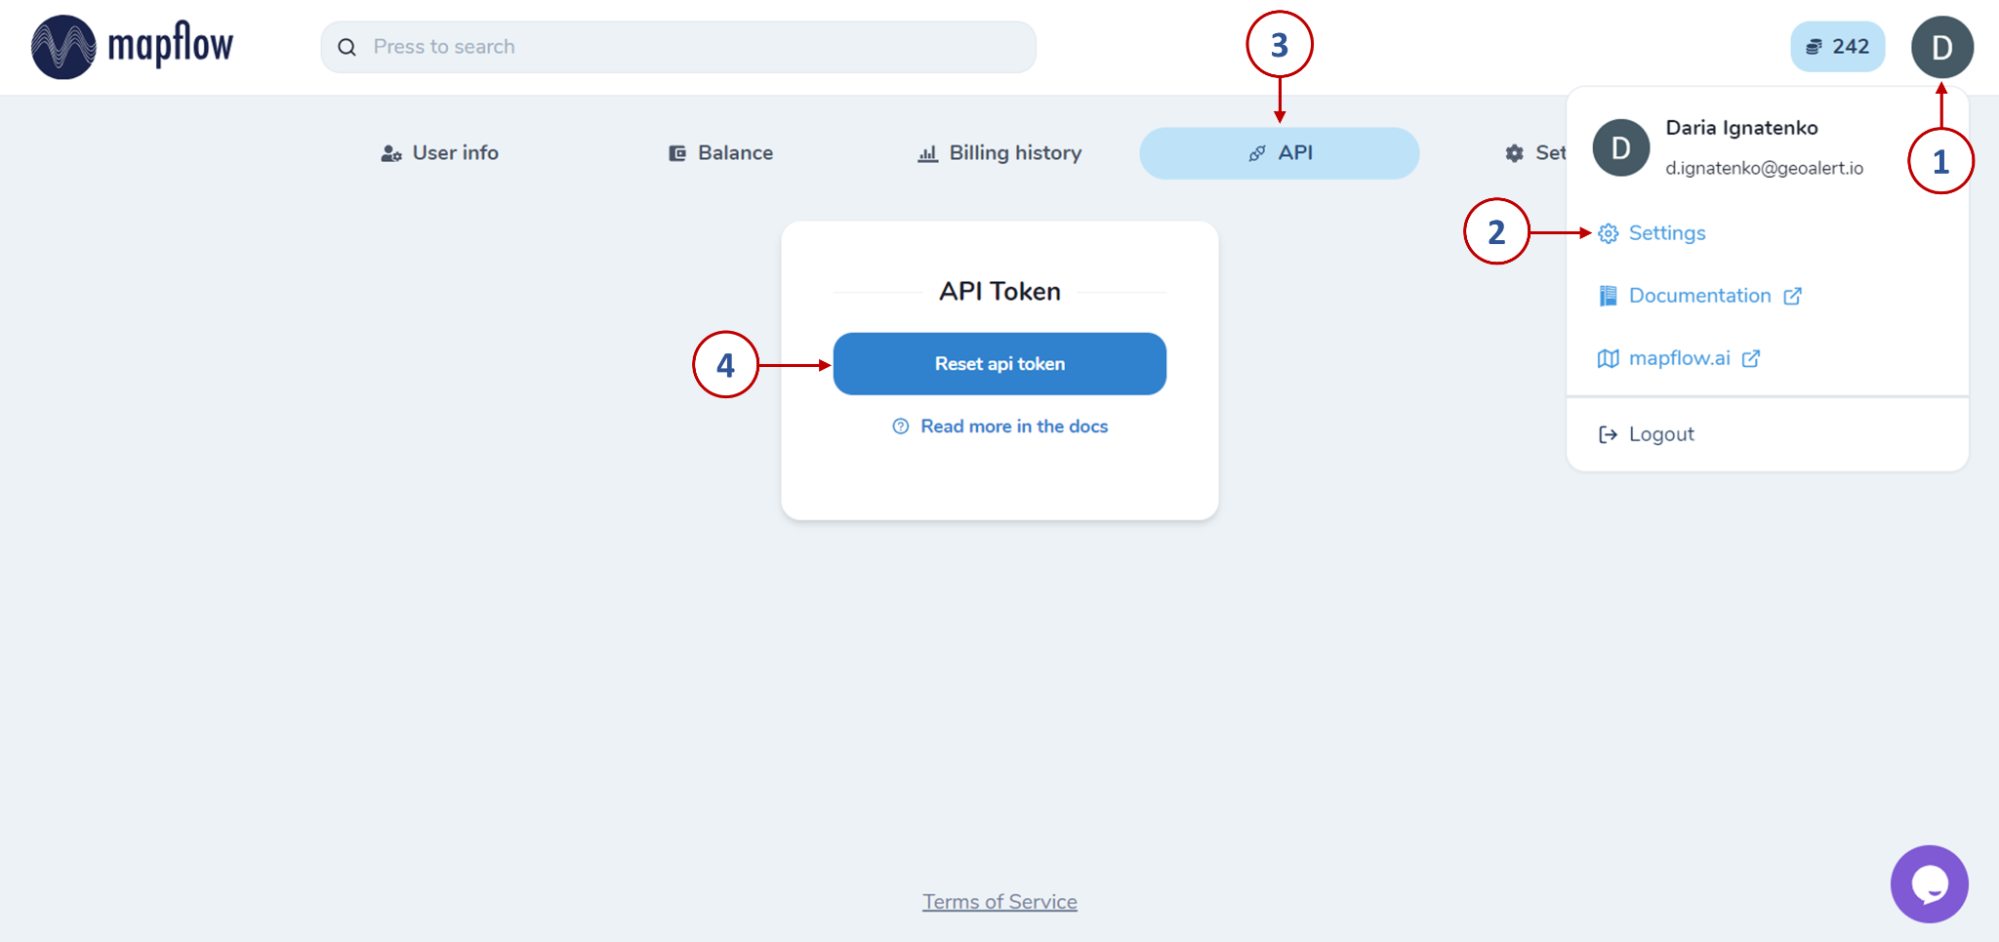
Откроется окно, в котором необходимо осуществить быструю и бесплатную регистрацию на Mapflow.ai. После чего, нажав на пользователя необходимо перейти в Настройки и выбрать вкладку API.
Нажав на кнопку «Сбросить api токен», мы получим доступ к ключу для авторизации, который необходимо скопировать и сохранить, а также вставить в окно авторизации в QGIS и нажать «Log in».
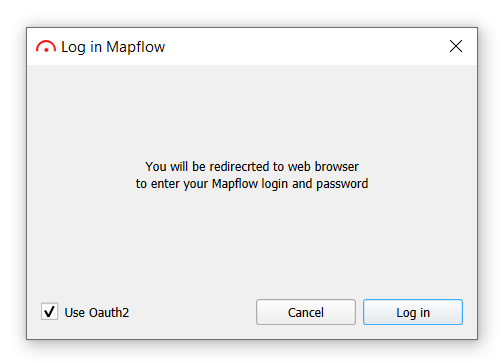
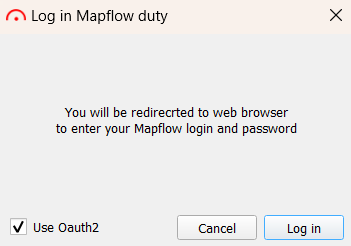
Иной способ авторизации в плагине – с использованием Oauth2. Отметив в окне авторизации соответствующую опцию галочкой, необходимо будет установить мастер-пароль.
Затем, следуя инструкциям, перезапустить QGIS и снова нажать «Log in». Это перенаправит Вас в браузер, где откроется окно авторизации в Mapflow. После успешного входа или регистрации откроется страница, уведомляющая об этом.
В QGIS откроется главное окно плагина – можно переходить к выполнению дальнейших шагов.
2. Распознавание объектов с помощью провайдера данных по умолчанию
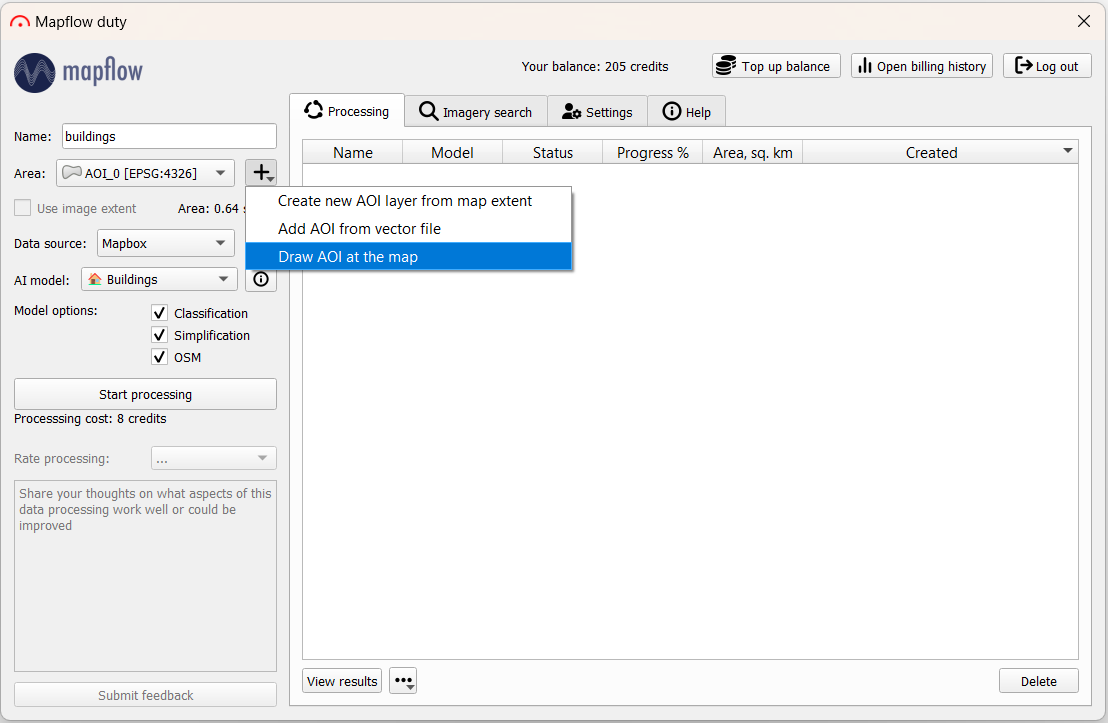
Для того, чтобы запустить обработку, прежде всего необходимо указать её название. Далее – выбрать территорию интереса, нарисовав ее на карте / подгрузив векторный слой с границами / взяв экстент карты.
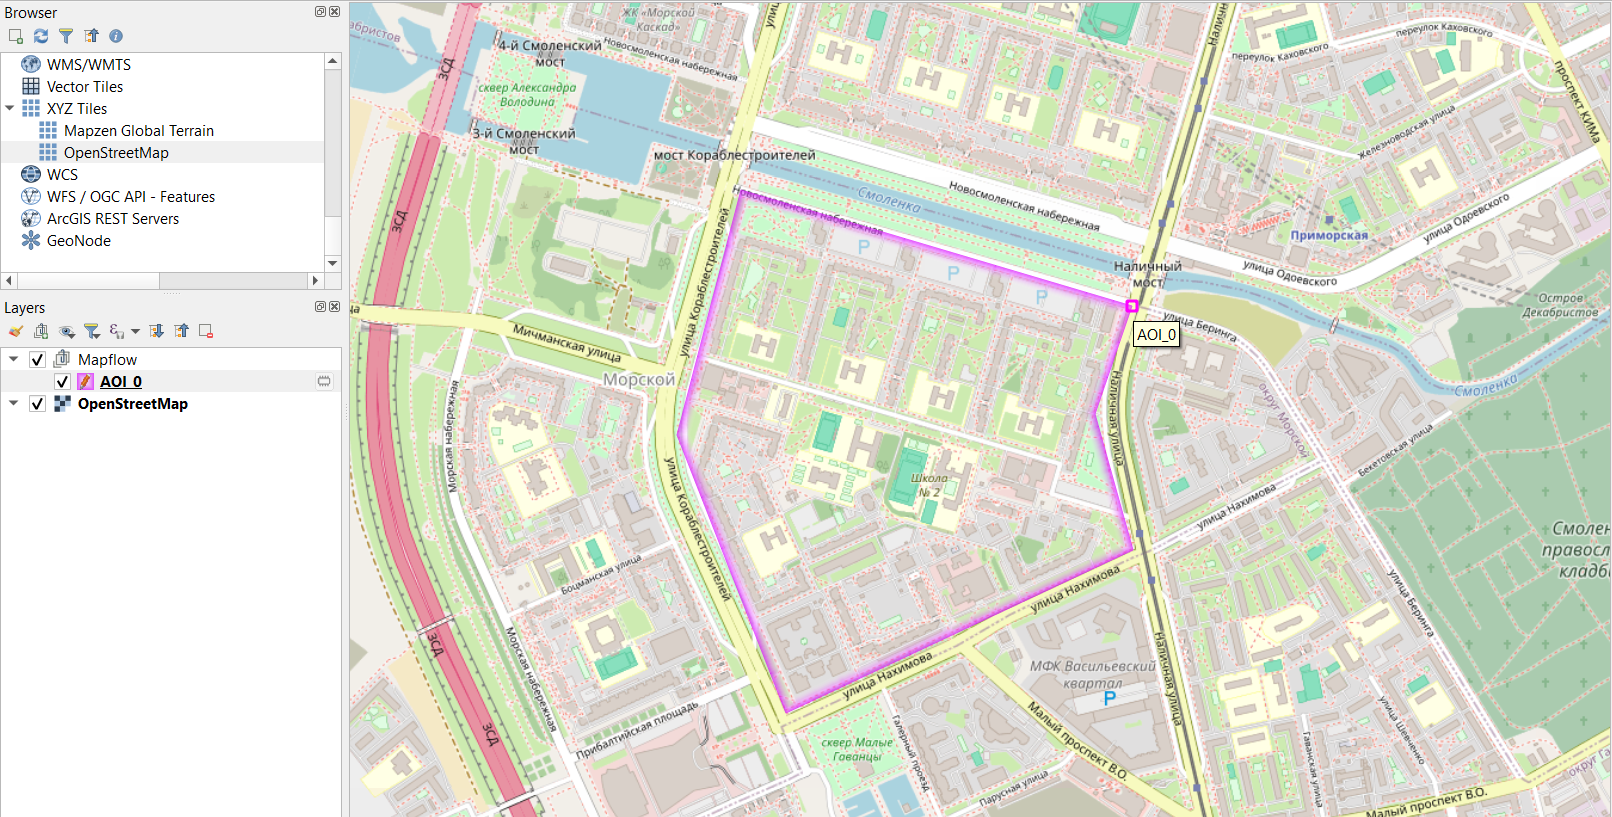
В левом верхнем углу в окне QGIS на панели «Browser» можно открыть подложку OpenStreetMap и сориентироваться по карте, чтобы обозначить интересующую территорию.
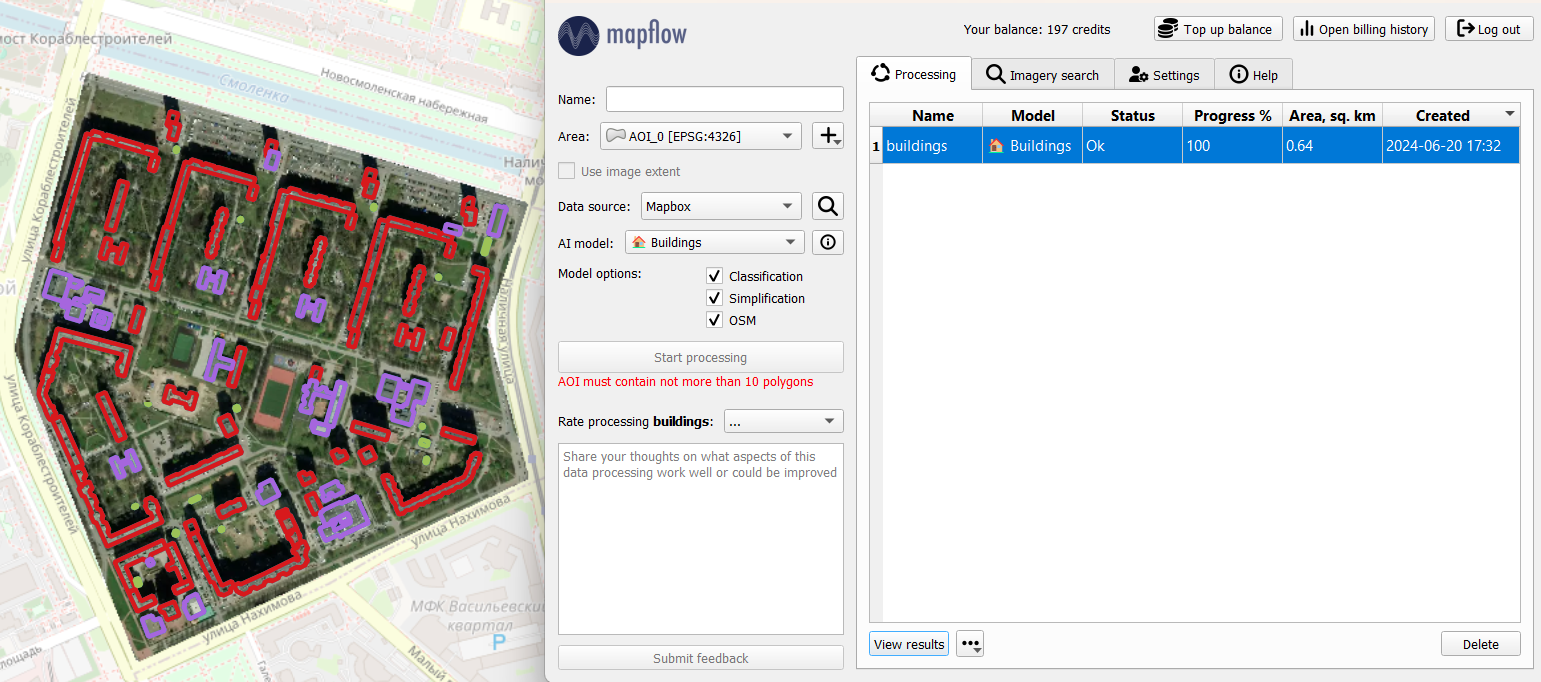
В окне плагина остальные параметры оставим дефолтными: в качестве провайдера данных – подложка с данными ДЗЗ от Mapbox, модель – для определения зданий. И нажмем «Start processing». В таблице обработок появится новая строка. По завершении обработки (Progress – 100%) спустя некоторое время можно подгрузить результат на карту, нажав на «View results» (или двойным кликом по строке). На карте отобразится растр и выделенные по нему объекты: здания, автоматически классифицированные по типу (где красный – residential, фиолетовый - commercial).
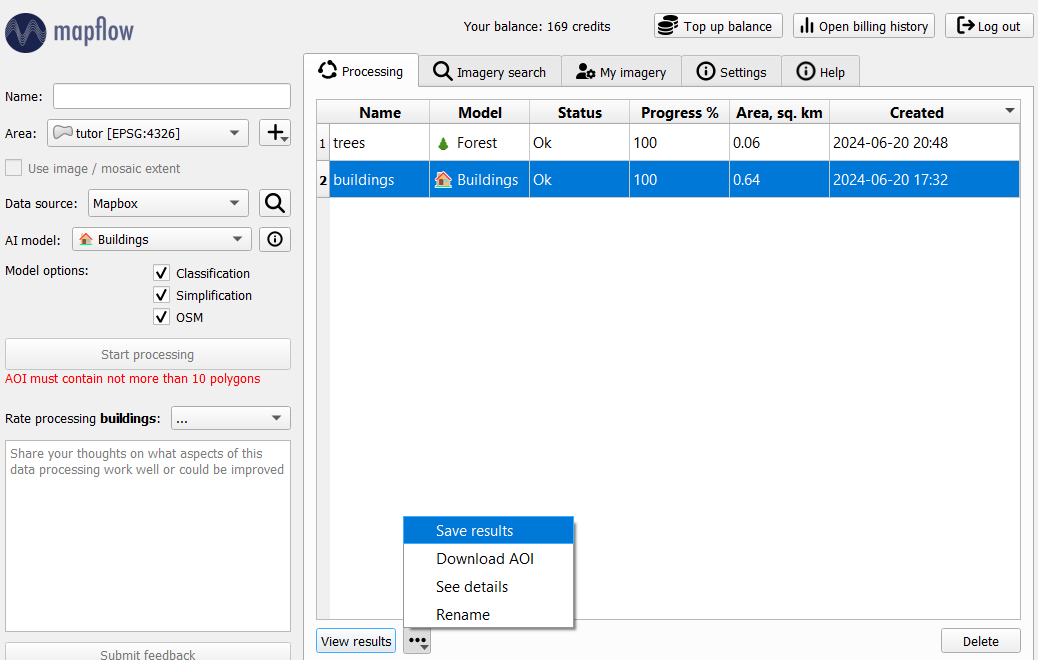
Полученные векторные объекты можно сохранить в формате GeoJSON (нажав на дополнительные опции рядом с View results) и далее использовать для картографирования, анализа или наполнять дополнительной атрибутивной информацией.
3. Распознавание объектов по собственным изображениям
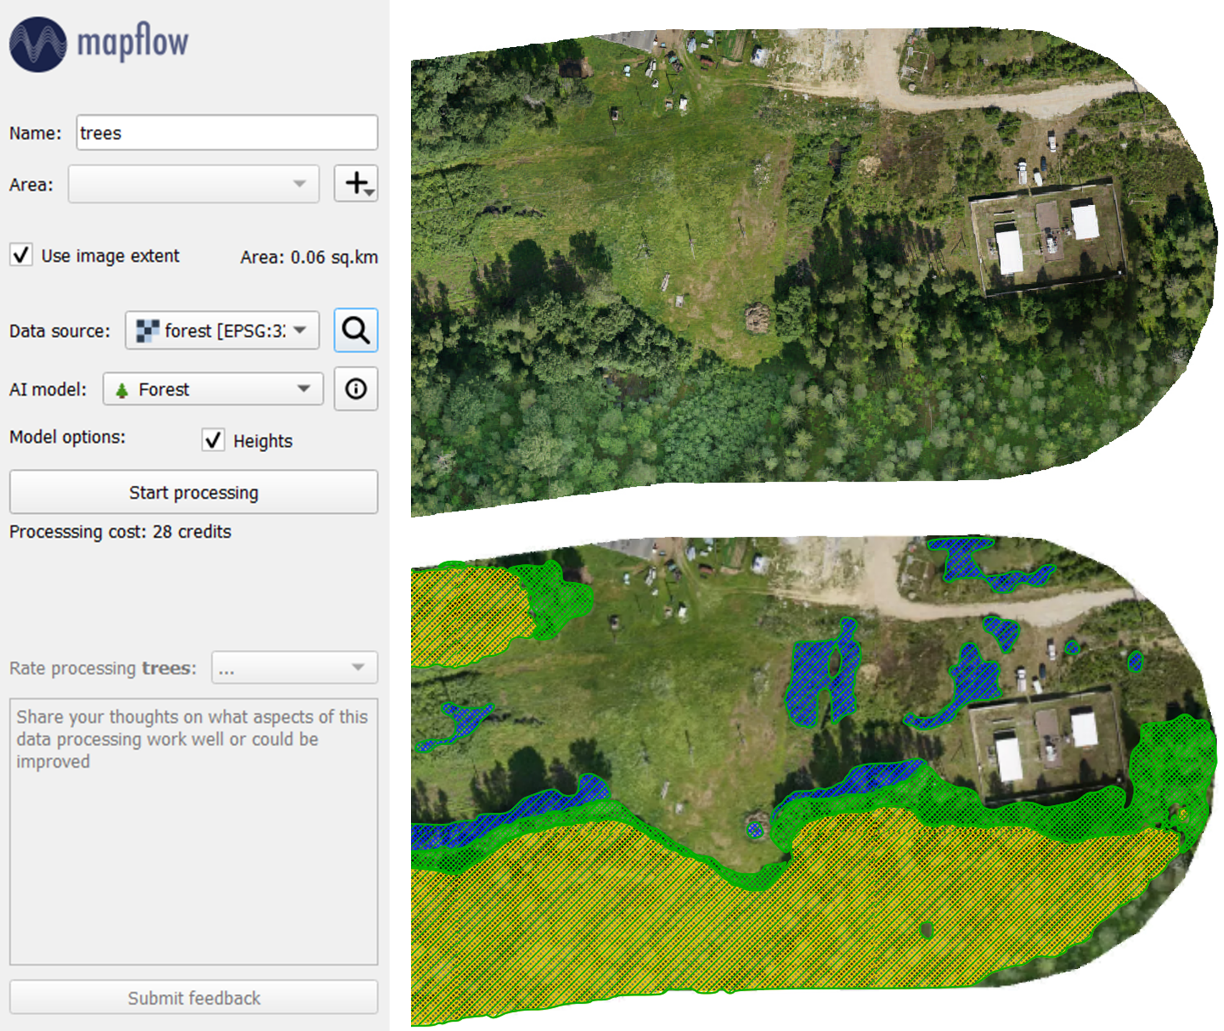
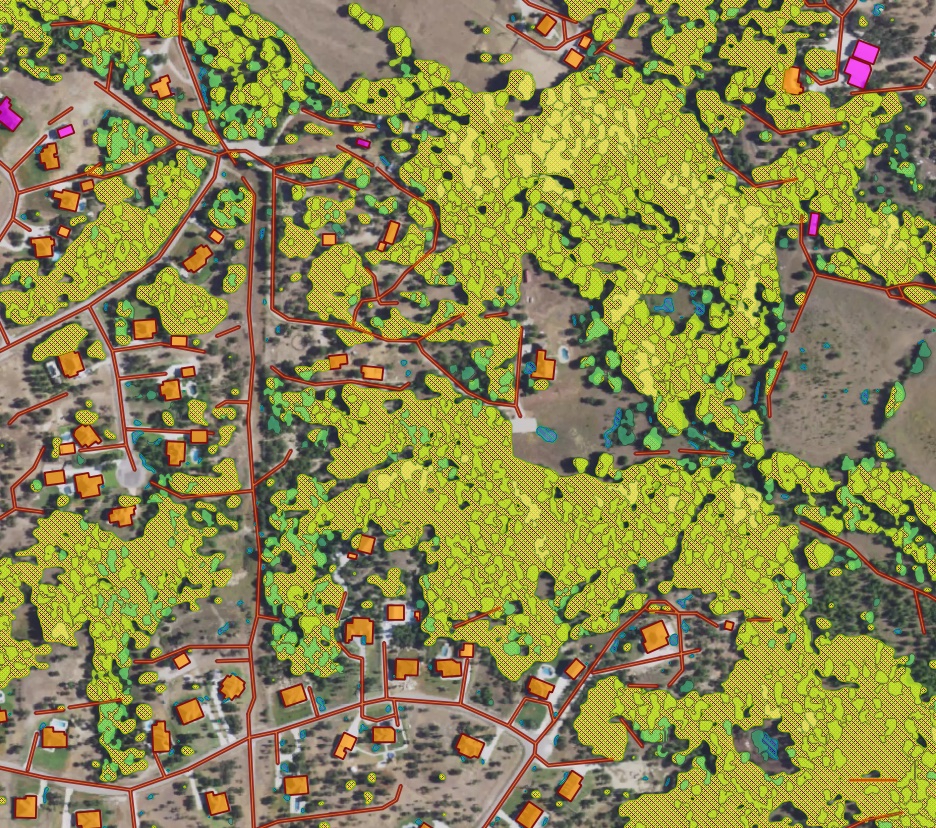
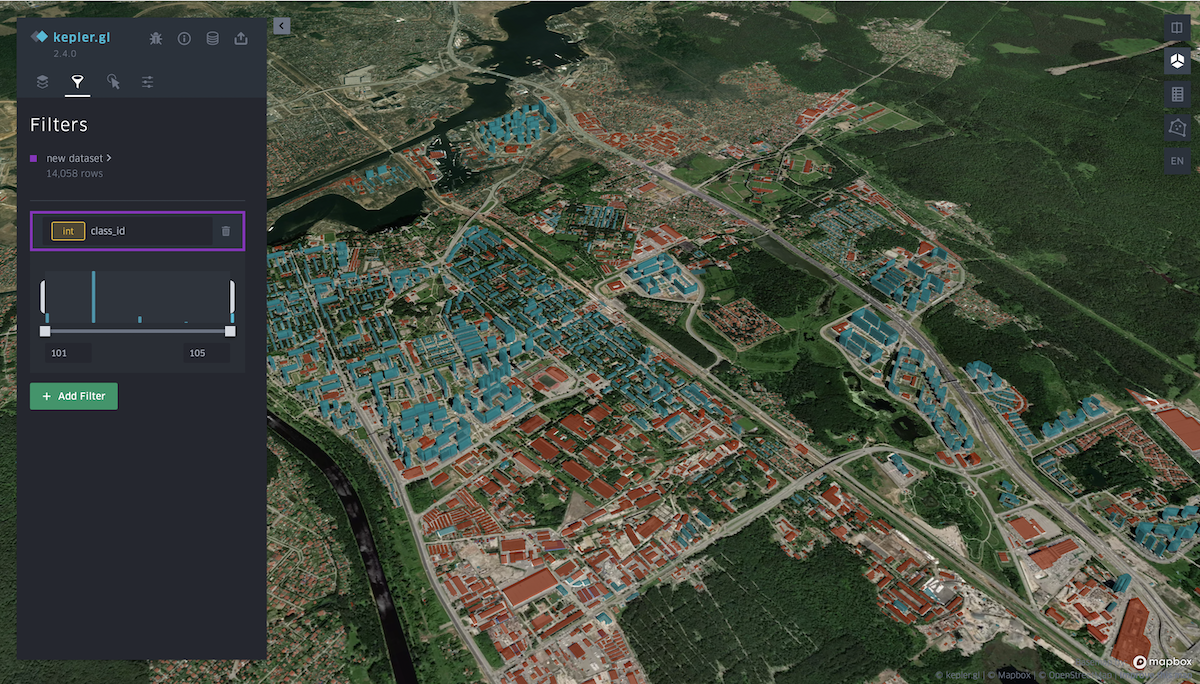
Выше рассмотрен один из наиболее простых сценариев работы с плагином Mapflow. Однако его функционал не ограничивается одним провайдером данных. Помимо дефолтных подложек, можно воспользоваться поиском по каталогу спутниковых снимков или использовать собственные изображения. Подгрузив в QGIS интересующее нас изображение, можем выбрать его в поле «Data source» и запустить по нему обработку. Результат: границы лесов разных категорий, дифференцированных по высоте.
Так, были рассмотрены основные возможности автоматизации оцифровки объектов различных категорий по растровым изображениям с помощью плагина Mapflow для QGIS. Помимо зданий и лесной растительности, существуют модели для распознавания дорог или участков строительства. Более обширный обзор возможностей плагина, а также различные варианты источников данных рассмотрены в документации Mapflow <> QGIS.
Как обрабатывать собственные снимки БПЛА с помощью Mapflow
Unmanned aerial vehicles – UAVs or, more commonly, drones – have become a deeply integrated part of the geomatic industry over the last ten years. This is owing to their increasing usability, falling hardware costs, and easing government regulations. Yet, as more data is available with UAV surveys, more data need to be processed operatively.
To process your UAV data you might be looking for some cloud or desktop software to create a mosaic or orthophoto. Do you know that you can easily publish your data with Openaerialmap and analyze (say detect and calculate some objects and calculate their areas) with Mapflow QGIS or Mapflow Web?
Let’s take the “UAV buildings” 🏠⭐️ Buildings (Aerial) (CUSTOM) model that extracts the detailed building outlines (the recommended image resolution is 10 cm).
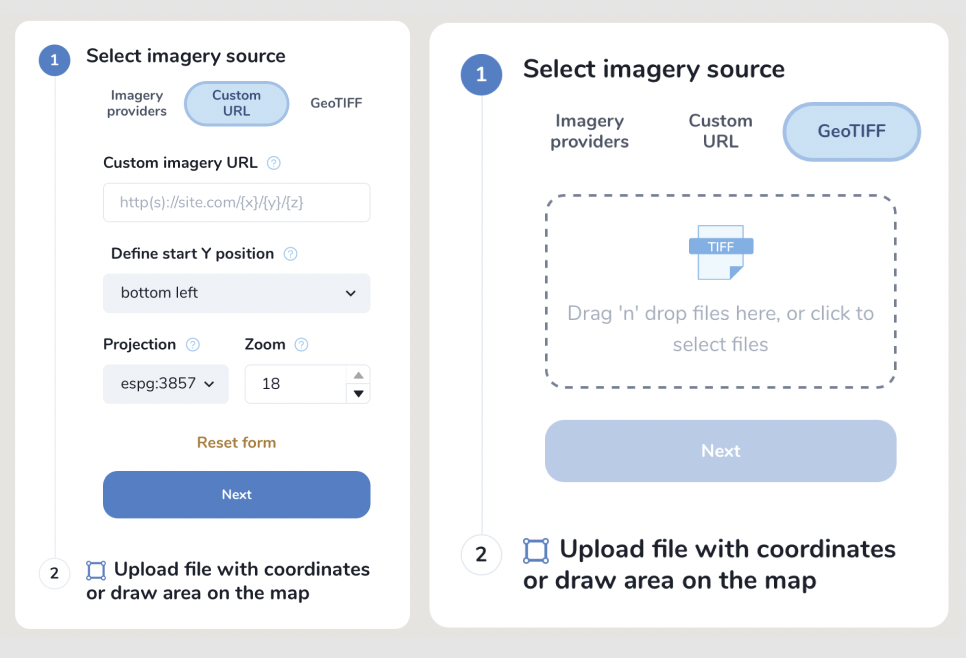
Select raster source – you can either use Custom URL (see below how to publish your image with Openaerialmap and get the TMS link) or upload your image as GeoTIFF.
Предупреждение
Currently, a preview of the uploaded image is not possible after loading the image, you will preview only the area of its extent.
2. Define the processing Area.
The processing area (AOI) must be located within the area of the image extent, otherwise, the area will be cut off by the extent boundaries. The processing area size is calculated by the intersection of the image extent and the AOI.
Важно
Image upload requirements:
The file size must be less than 1 Gb. Both sides image dimmesions must not exceed 30.000x30.000
The image must be georeferenced and the CRS must be one of:
* WGS84 (EPSG: 4326)
* Web mercator (EPSG: 3857)
* UTM (any zone)
If your image doesn’t meet the parameters, we suggest using Mapflow API / QGIS plugin which has more capabilities.
Mapflow supports RGB imagery and also processes single-band (panchromatic) imagery, but the AI models are not tuned for such kind of data, so the quality of the result may be worse than expected.
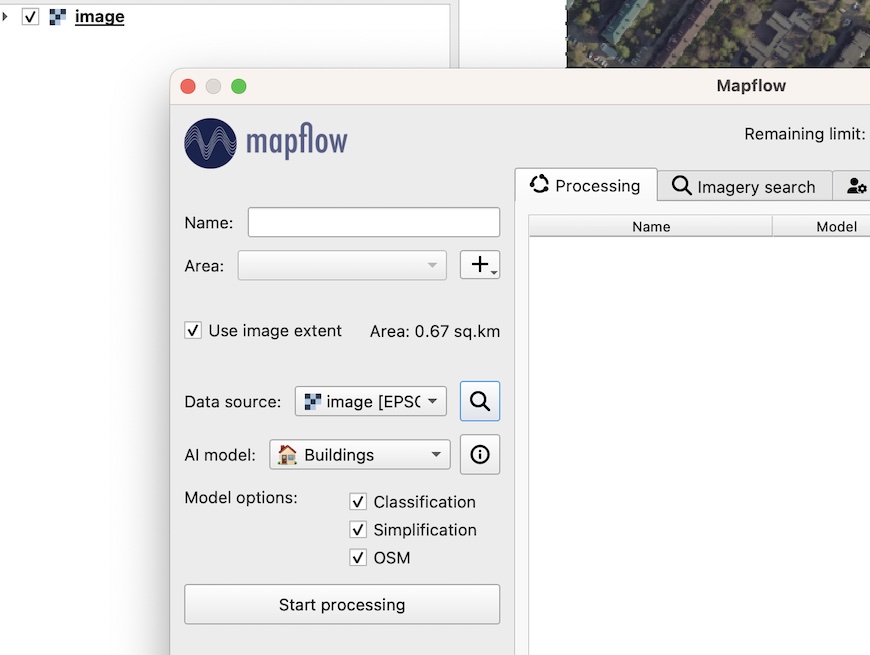
You can upload your own GeoTIFF (up to 1 GB, max. 30000x30000 px. by default). All raster layers loaded in your QGIS (1) are visible in the drop-down list (2) and can be selected for upload.
Важно
Please, consider the requirements for AI Models when uploading your own images.
Contact us if you have difficulties to handle a large dataset or your file size exceeds our limits.
Как использовать внешние провайдеры данных в Mapflow
Использование OpenAerialMap как сервиса публикации и доступа к снимкам
OpenAerialMap is an open collection of UAV imagery data, crowdsourced by users. The project is supported by a consortium of companies developing open source software and services for working with spatial data.
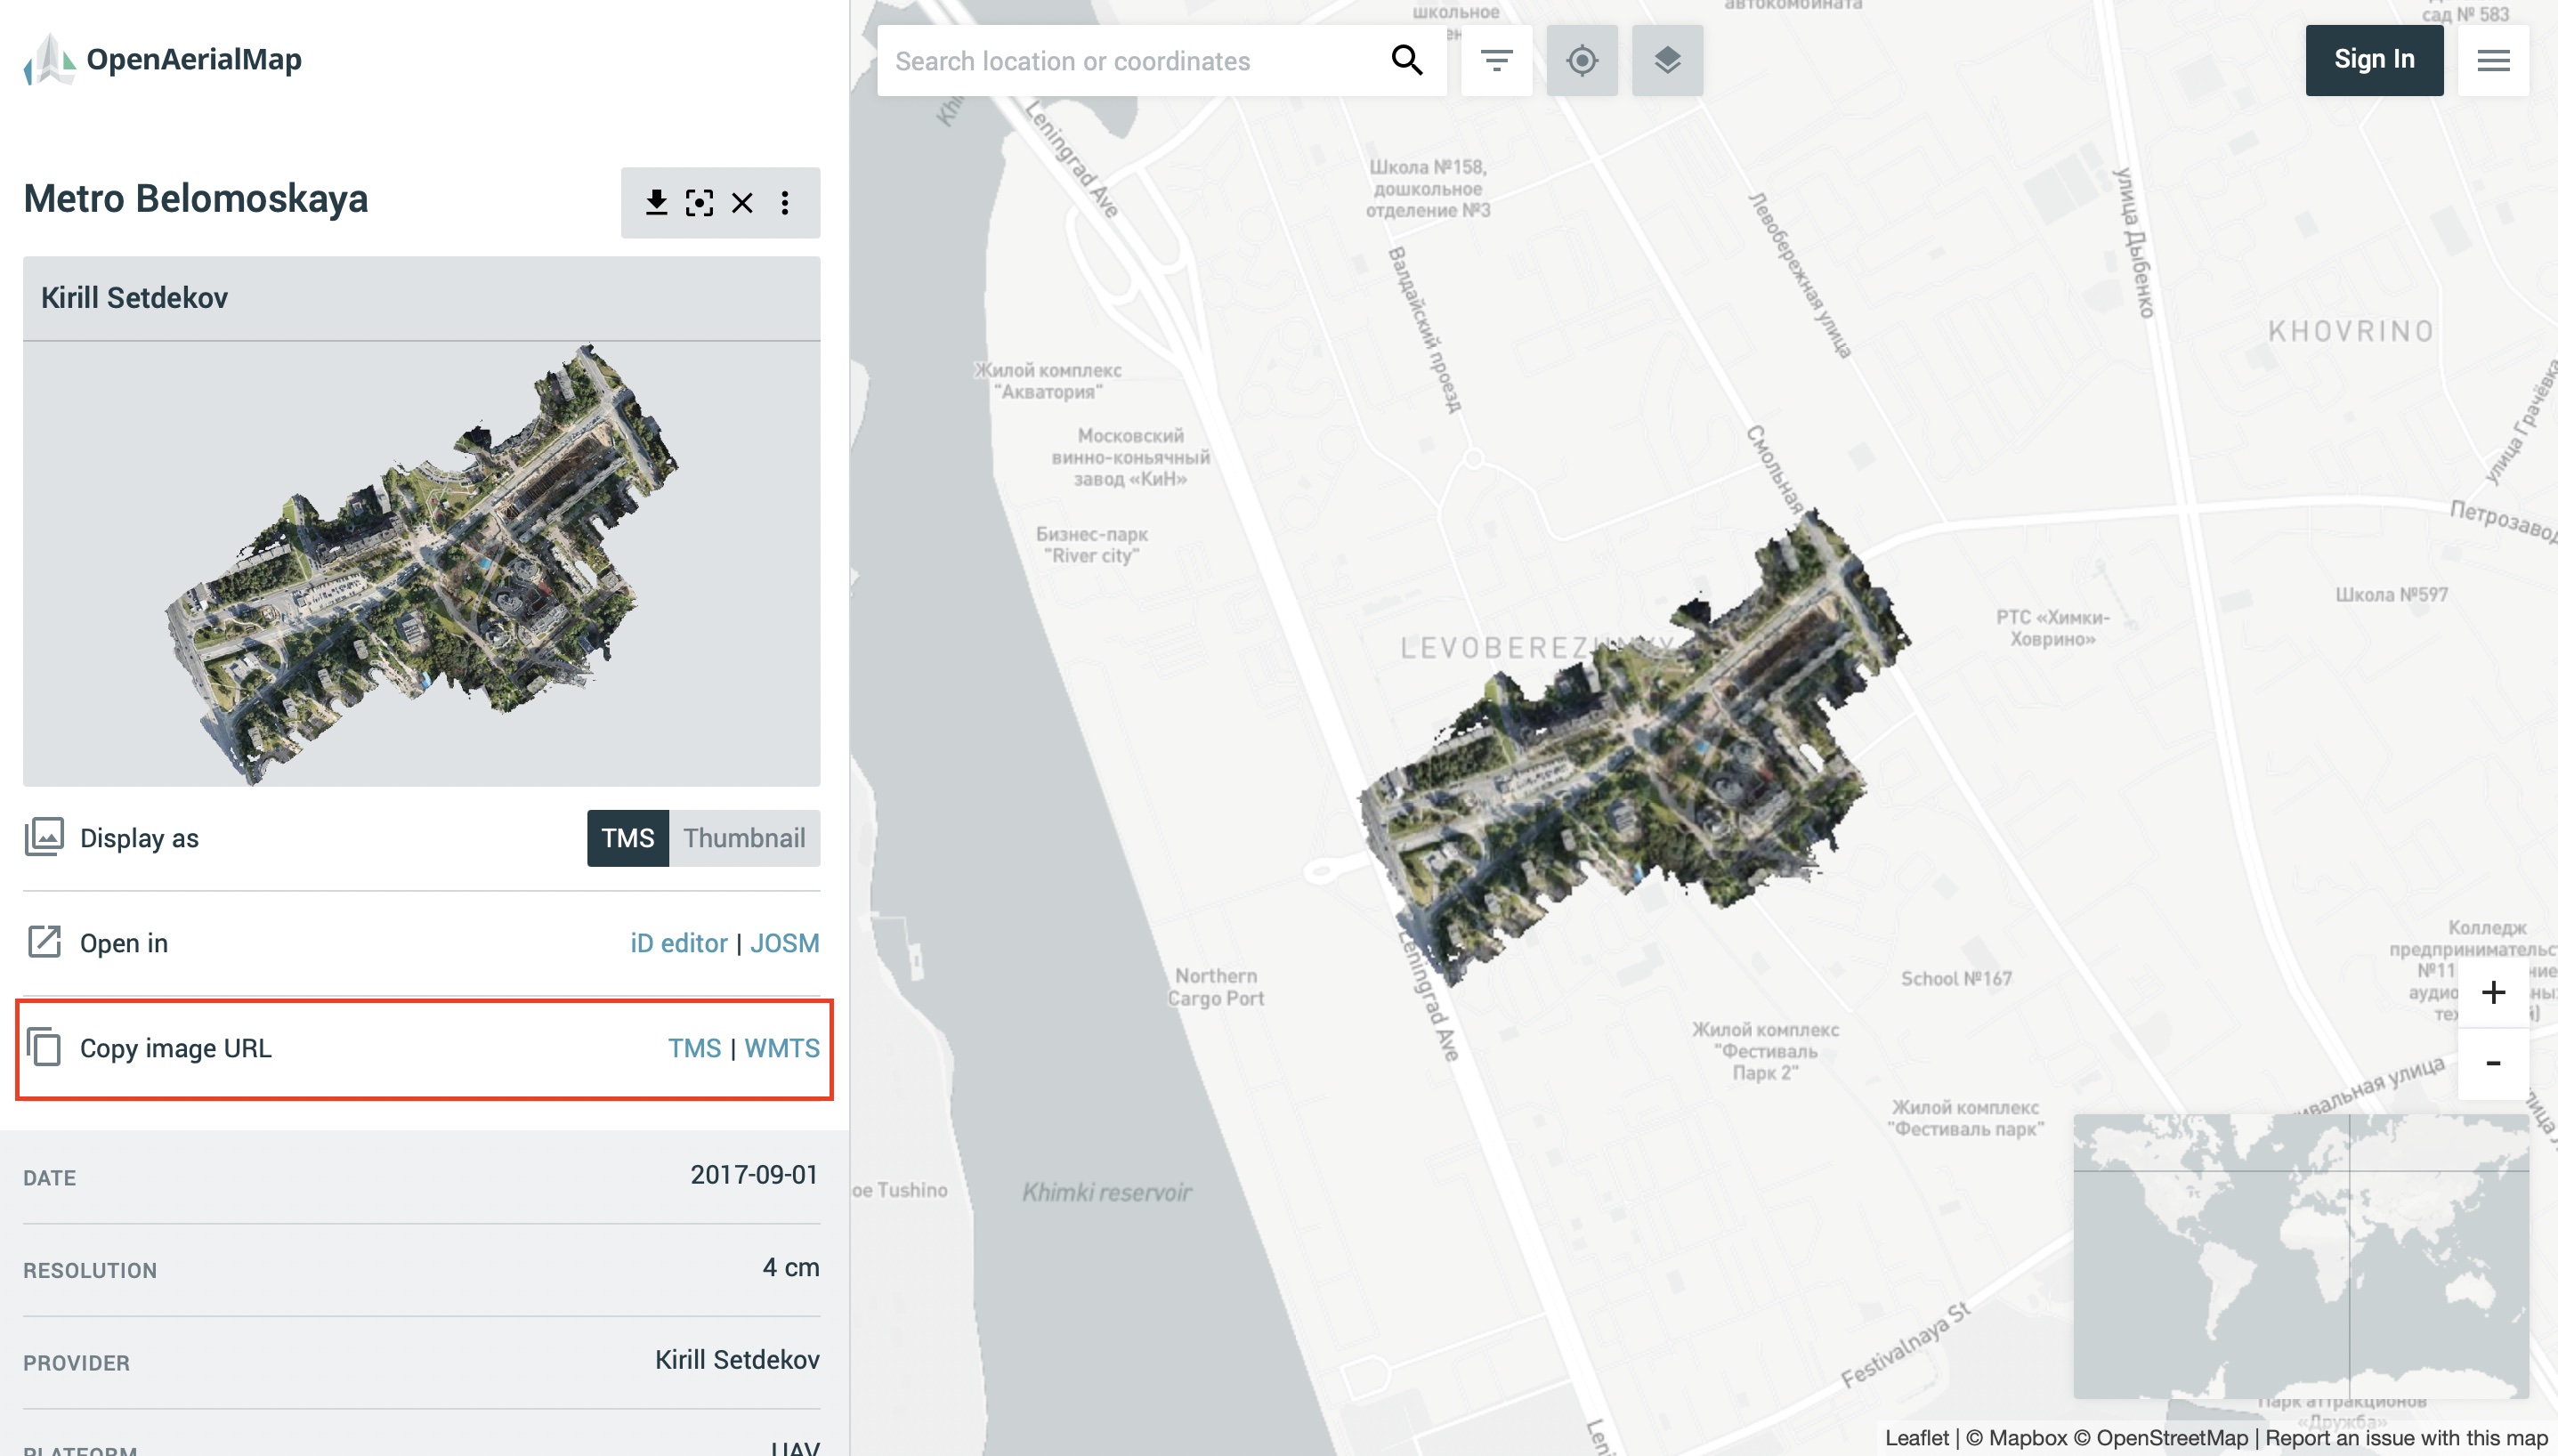
As soon as your aerial image is published on OpenAerialMap it’s presented on the public map and can be fetched using TMS/WMTS protocols.
Выберите снимок и скопируйте ссылку TMS для подключения к Mapflow через пользовательский URL.
Copy link to TMS and paste it into the “Custom imagery URL” in your new Mapflow processing.
Check if you see the image on the map, go through the next steps (AI model, processing params) to and start the processing.
..note::
Your can use this service to publish your own UAV data (note that it will become publicly accessible).
As soon as your aerial image is published on Openaerialmap it’s displayed on the public map and can be connected using TMS/WMTS or downloaded as GeoTIFF file.
Both ways are OK to work with Mapflow.
Использование Nearmap в качестве провайдера снимков
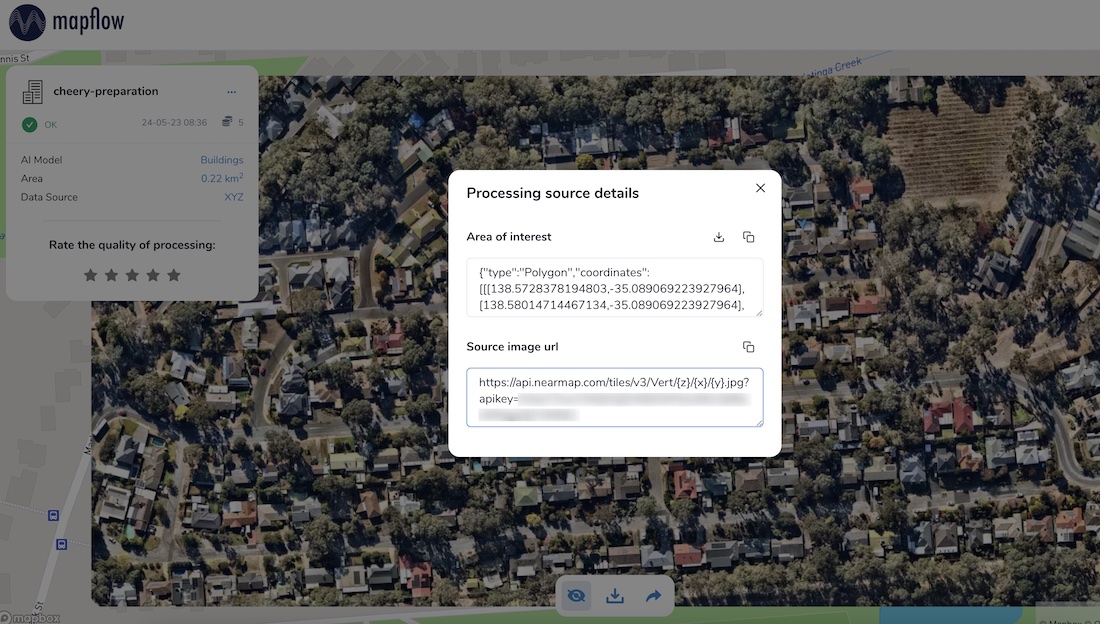
Nearmap provides access to its Vertical and Panorama Imagery via a Tile API. If you have a subscription to their service you can use it easily with Mapflow Custom URL.
NAIP (National Agriculture Imagery Program) provides public access to aerial imagery for the US territory. The data is available as a set of tiles via TMS protocol. It’s effectively public-domain data so you are free to use, redistribute, incorporate into commercial or open-source projects, or mix with other data.
To use NAIP data with Mapflow Custom URL, you can use the following TMS URL template:
Подготовка и оптимизация изображений большого размера
Here are few tips on how to prepare and optimize your data and reduce the image size to upload it faster and not to exceed the Mapflow upload limit.
Usually UAV image is an RGB compiosite provided as GeoTIFF of 16 or 8 bit.
The data type will be automatically converted to 8 bit on the side of the Mapflow.
Alternatively: use the preprocessing script for preparing your image for Mapflow processing.
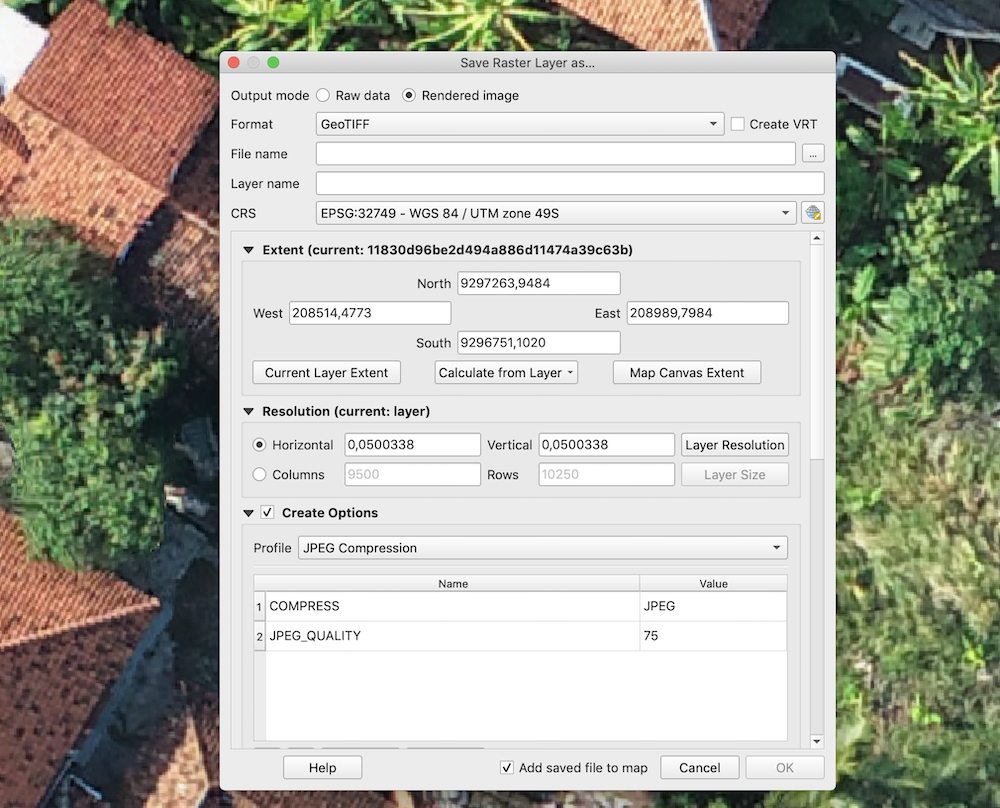
You can reduce the size of the image using GDAL translate. (https://gdal.org/)
E.g. using JPEG compression.
gdal_translate-cocompress=JPEGinput.tifoutput.tif
By default the compression quality is 75% (gdal_translate-cocompress=JPEG-cojpeg_quality=75input.tifoutput.tif) but it doesn’t really impact the quality of the Mapflow mask whenever the resolution of the input iage meets the recommended params.
То же самое можно сделать через интерфейс QGIS:
Tell us if you have more tips to share with the community or if you have more questions – we are ready to help.
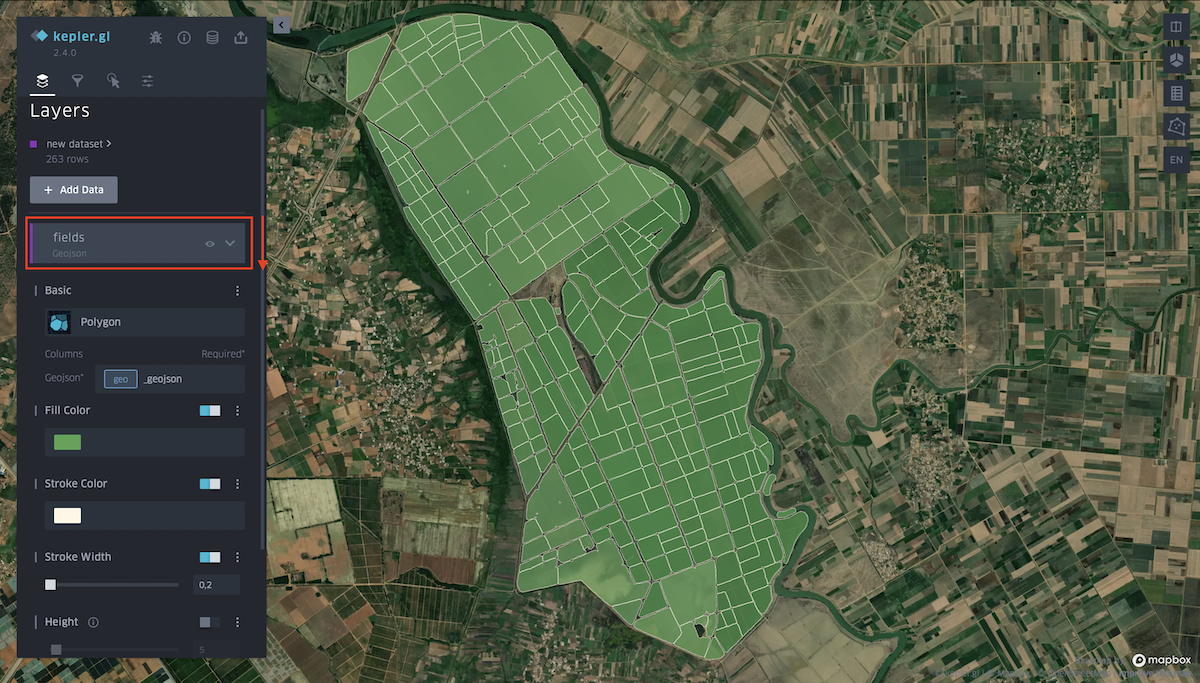
Click on the layer name to bring up the Layer settings from the drop-down menu. To hide all data, click on the eye icon.
These settings allow you to choose a more suitable type of received data:
Fill color. You can choose any color from the palette for polygons, and also hide the display of data by changing the position of the slider. You can change the transparency of polygons (property Opacity) in the additional settings of this function.
Stroke color. You can choose any color from the palette for outlining polygons, as well as completely remove the stroke. You can change the transparency of the stroke (property Opacity) In the additional settings of this function.
Stroke width. Controls the thickness of the stroke.
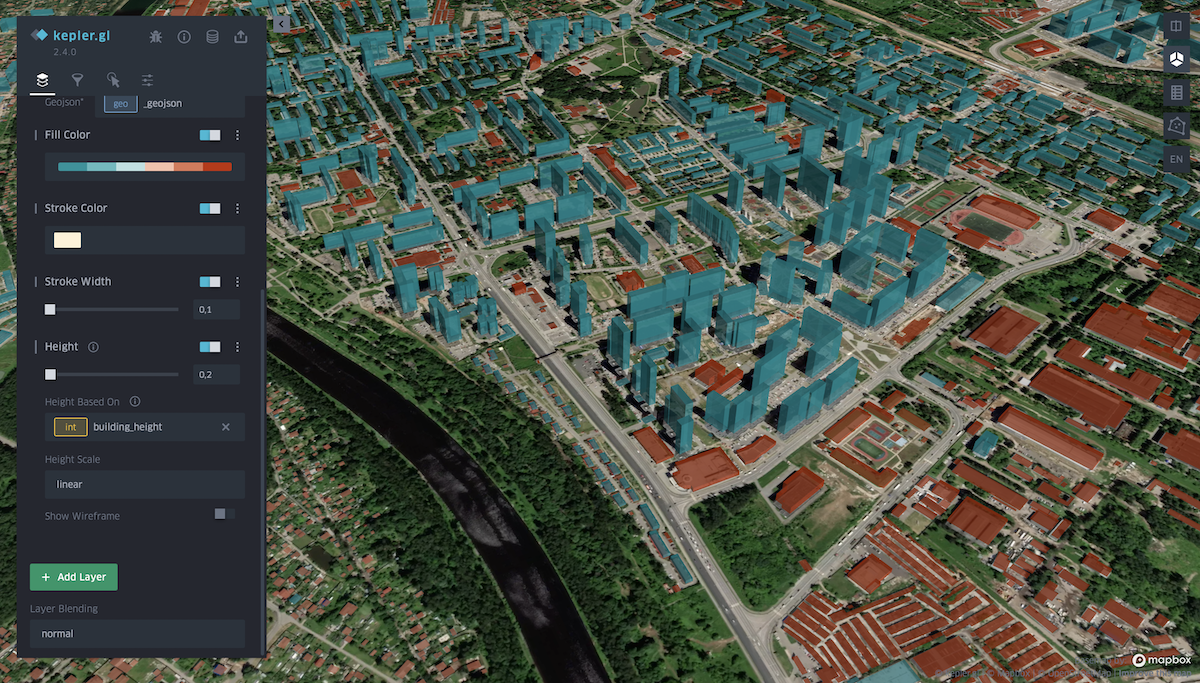
Height. Allows you to view data with heights in 3D format. Set the desired coefficient and select the attribute of the layer with heights.
This tab allows you to add a filter of interest by a specific attribute of the layer (as in this case, the filter is set by classes with different typology of buildings).
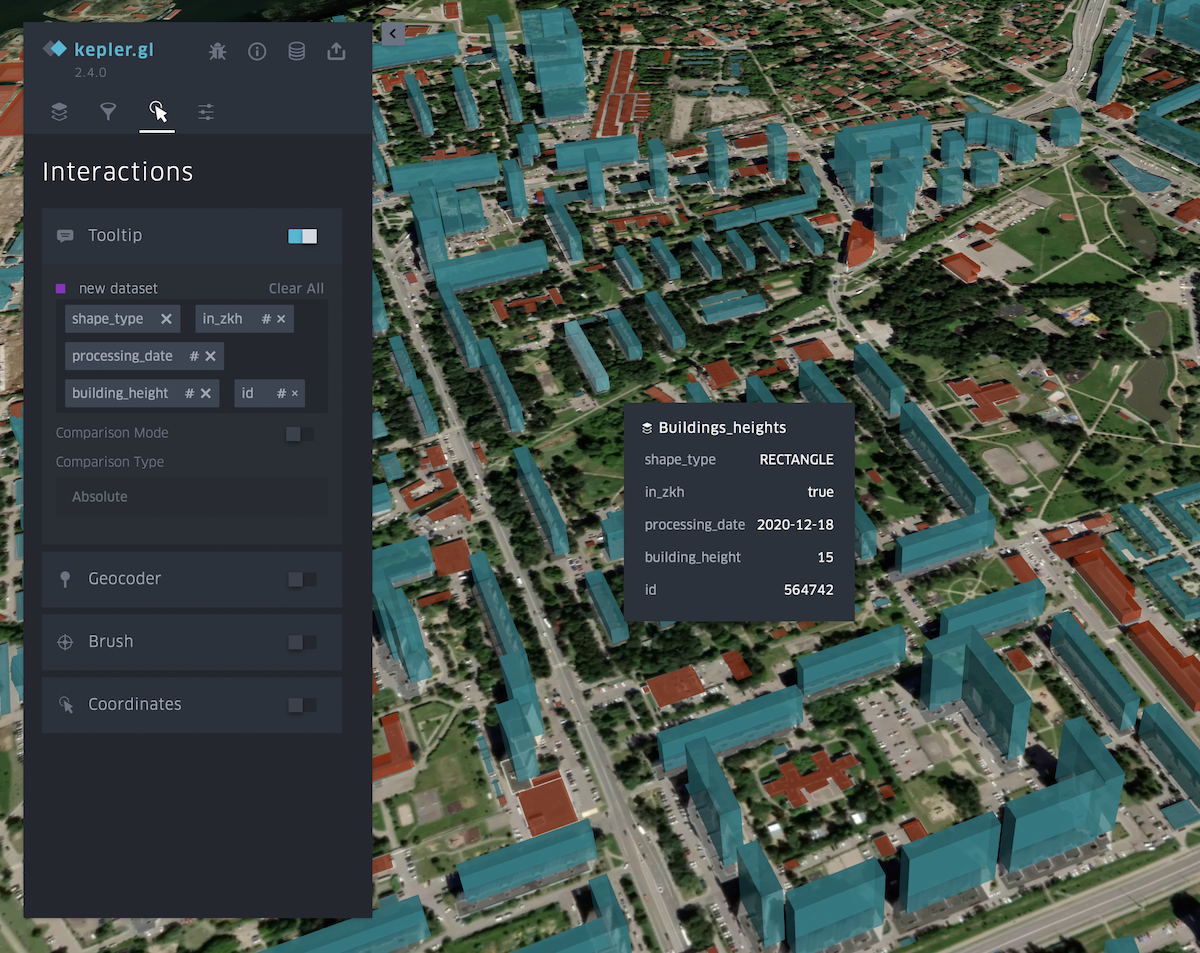
You can select or remove attributes that will be visible in the menu that appears when you hover over an object. It is also possible to turn on the panel indicating longitude and latitude.
Currently, you have to contact us if you have a request to run Mapflow (as a platform or as a separate imagery analysis workflows) on external infrastructure.
However, we partner with cloud integrators to conduct projects for their clients.
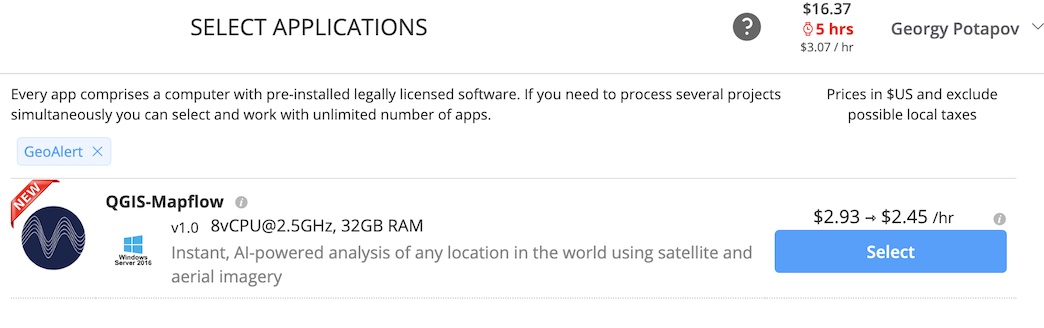
Create an account at Geocloud and run the app «QGIS-Mapflow».
It runs the virtual machine with minimum requirements for QGIS with a preinstalled Mapflow plugin.
Note that you have to run consequently the Storage and the Desktop to get connected to the virtual machine with a remote desktop.
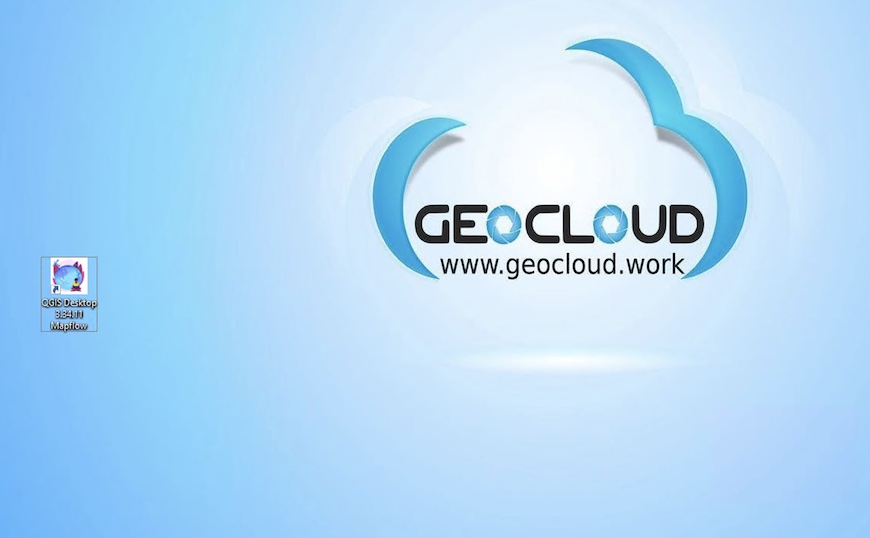
Run QGIS by clicking on the «QGIS-Mapflow» icon at the desktop workspace
Run the plugin by clicking on the icon in the toolbar
Важно
❗️ To enable Mapflow oAuth login use the master password for QGIS which is set to 123456
Примечание
After you click the «Login» button you will be redirected to the Mapflow login page in the browser. Use your existing Mapflow.ai login and password or create a new account to start working with the plugin.
You can also use Basic auth (disable «Use OAuth» checkbox) with your Mapflow Token.
Note that you pay only for the up time in Geocloud. You spend your regular credits for Mapflow (you get 250 credits for free upon the registration).
There are two prices for Storage / Computer in Geocloud - Stopped and Working. The Stopped price is applied when Storage / Computer is stopped. The Working price is applied when it is in the working mode. 👉👉 You can stop your computer while doing some long-lasting calculations in Mapflow to spend less.
Как проверить метаданные снимков в 🌏 Глобальной мозаике
Mapflow Imagery Search enables searching metadata for mosaic providers (e.g., ArcGIS World Imagery, Global mosaic).
Примечание
🌏 Global mosaic is the annually updated satellite imagery composite covering most of the World. The mosaic is composed of «Jilin» Chinese satellites imagery (RGB, 0.75–0.5 m/px). The preview is limited to zoom 14.
🌏 ArcGIS World Imagery is a provider of the global coverage composed of high and medium resolution satellite imagery and aerial imagery, hosted by ESRI. The frequency of updating images is 1-5 years depending on the territory.
How to use Mapflow – QGIS to search for mosaic’s metadata and run the analysis:
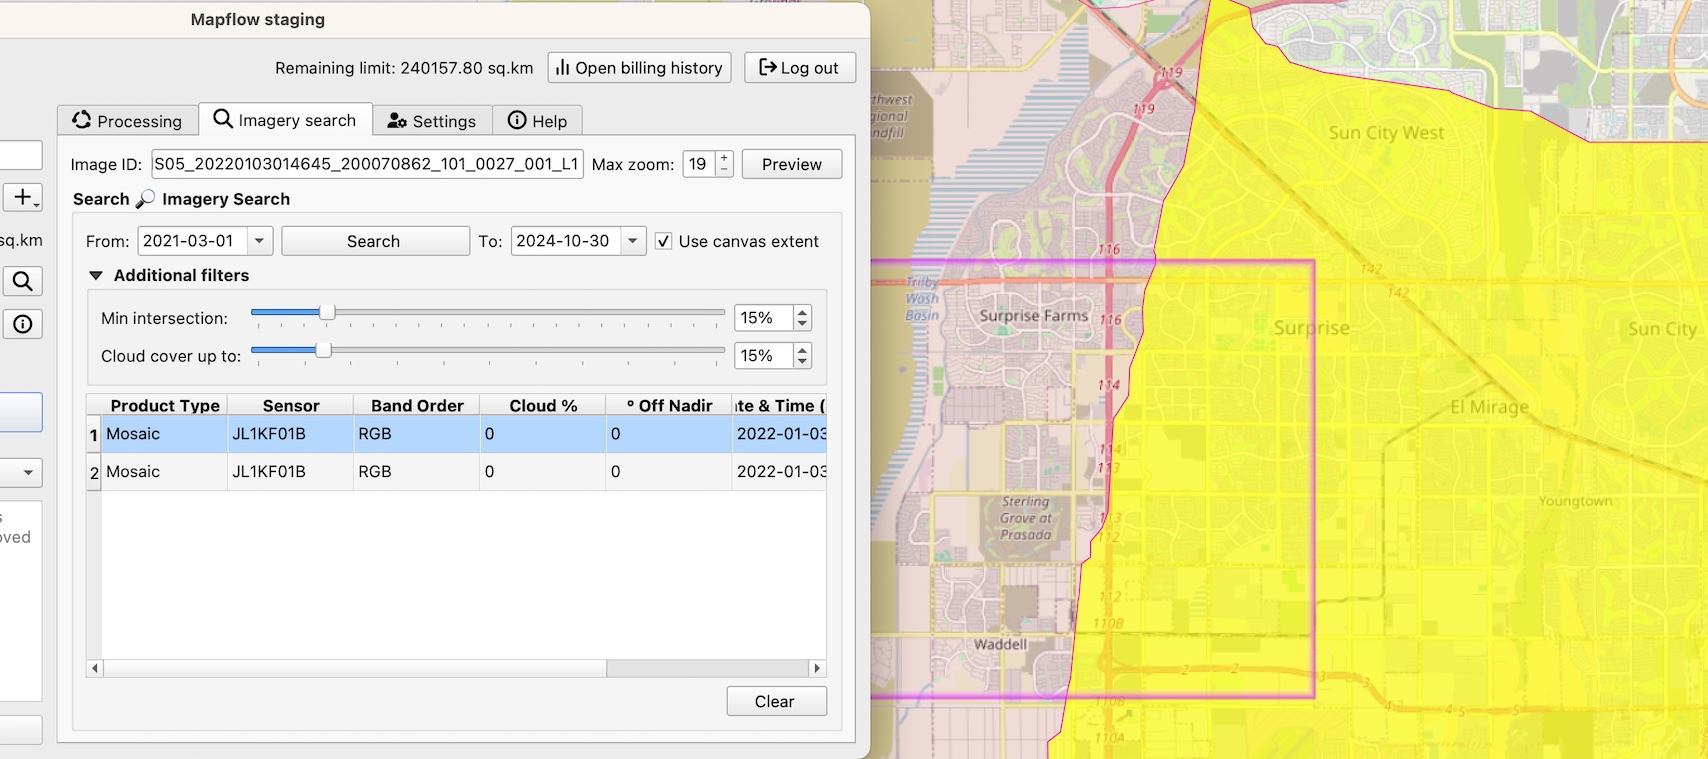
Перейдите на вкладку «Imagery Search».
Set search filter parameters including the area (it can be your area of analysis or a map canvas), period of time, cloud %, and the % of the intersection with AOI.
Select the «Product type = Mosaic» in the Search results. You will see the mosaic image «cutline» indicating the specific image that is used in the mosaic.
Примечание
There are two types of products in the Imagery Search API available:
* The Scene product is available for ordering by request. Now you need to contact us to order the specific image.
* The Mosaic product is available for instant analysis if the corresponding data provider is linked to your Mapflow account.
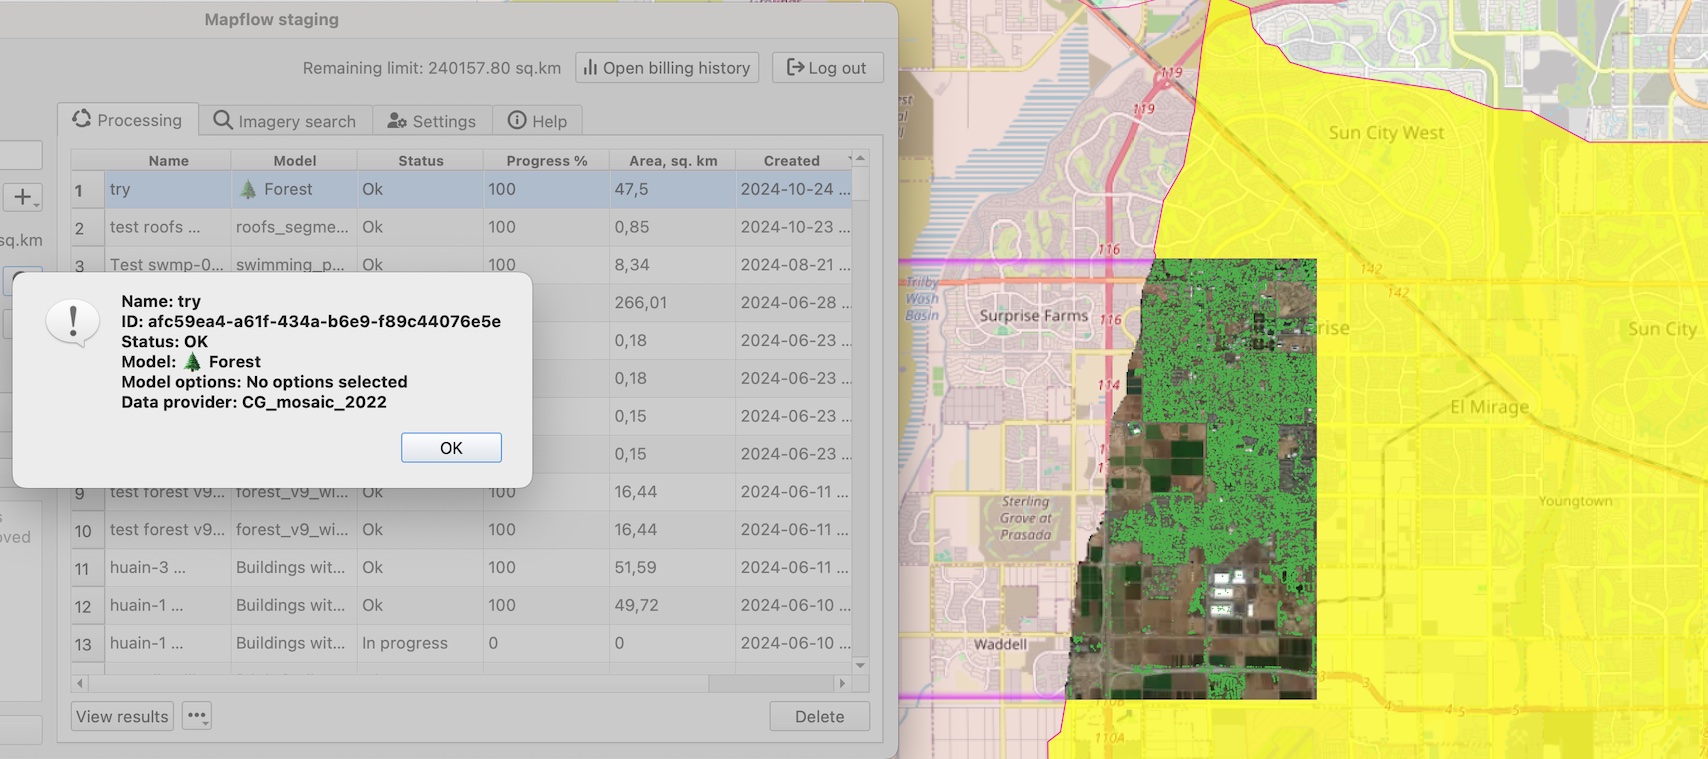
Run the processing. The resulting area of analysis will be clipped by the intersection with the area of analysis.
To run the processing over the whole area of analysis – just clear the selection and use the Data Source: 🌏 Global mosaic 2022 or the Data Source: 🌏 ArcGIS World Imagery.
Как запустить пакетную обработку с помощью Mapflow API